Background
- The MacArthur Foundation Research Network on an Aging Society initiated this study to better understand the factors that drive past, current, and future trends in longevity, and as a way to inform the development of public policy that will help to improve the face of aging in America.
- Evelyn Kitagawa and Phil Hauser from the University of Chicago empirically established the linkage between education and mortality/longevity in 1973. The effects of race on longevity have also been well established, although very few studies have examined the combined effects of age, sex, race, and education (including data that demarcate the least educated) on duration of life.
- Education exerts its beneficial effects on longevity through the adoption of healthier lifestyles, better ability to cope with stress, better access to health care and insurance, more effective management of chronic diseases, higher income, and privileged social position.
- In this paper we update these linkages for the US population using the most recent data (2008); extend the linkage to four education categories that importantly includes the addition of those with less than a high school education; and we examine these linkages by sex for three race groups (blacks, non-Hispanic whites, and Hispanics).
Data
- Deaths were drawn from Multiple Cause of Death data files from the National Center for Health Statistics (NCHS) – this includes all deaths recorded among U.S. residents.
- Population counts were drawn from the NCHS/U.S. Census Bureau.
- The American Community Survey Public Use Microdata Sample File was used to stratify the population by educational attainment.
- Time frame: 1990 – 2008
- Education categories for the population aged 25+: <= 12, 12, 13-15, 16+
- Race categories: Blacks, Hispanics, Non-Hispanic whites
- Age categories: life expectancy at birth, 20, 25, 40, 60, 65, 80
- Life expectancy should be interpreted as expected remaining years of life.
Results
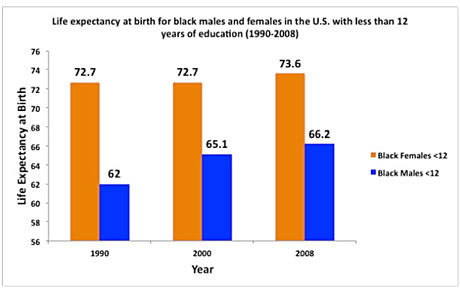
- Drop in life expectancy for least educated whites, slight increase for least educated blacks. It is important to note that the size of the least educated subgroup of the U.S. population has been shrinking in recent decades (down to about 8% for whites). This is good news on the one hand since this suggests that younger cohorts moving up through the age structure are more highly educated than their predecessors. The bad news is that this decline in the least educated population is occurring, in part, because they die younger than their more highly educated counterparts. This leads to what is known as selection bias – that is, the dynamics of the group being investigated are changing with time. This selection process is quite common as it accounts for the changing dynamics of all subgroups of a population facing different levels of mortality – such as smokers versus non-smokers or people at low versus high risk of cancer. This may partially explain the trends in life expectancy we observe here, but the rising death rates are nevertheless quite real.

- Result: Disparities at the educational extremes are astonishingly large, and growing larger. While a 1-year difference in life expectancy should be considered sizeable, we found that in 2008 white males with 16+ years of education now live 14.2 years longer than black men with less than 12 years of education. The difference is 10.3 years for women. These trends in disparities at the educational extremes are widening. In 1990 the most educated men and women lived 13.4 years and 7.7 years longer, respectively, than the least educated. Listed below are differences in life expectancy at birth between the most and least educated, within race/sex groups. By way of example, in 1990 the gap in life expectancy between the most and least educated white females was 1.9 years; now it’s 10.4 years, etc.
|
|
Year |
Gap in Life Exp. |
Year |
Gap in Life Exp. |
|
White Females |
1990 |
1.9 years |
2008 |
10.4 years |
|
Black Females |
1990 |
1.9 years |
2008 |
6.5 years |
|
White Males |
1990 |
4.9 years |
2008 |
12.9 years |
|
Black Males |
1990 |
6.0 years |
2008 |
9.7 years |
- Result: Rise in life expectancy for everyone with 16+ years of education. At the highest level of education, life expectancy has risen rapidly, and blacks are catching up to whites. The average increase in life expectancy for the most educated whites from 1990-2008 was 4.3 years for whites and 6.7 years for blacks. Thus, the reason for the racial convergence in life expectancy among those with the highest level of education is because of more rapid improvements in longevity for blacks relative to whites – although both racial groups at the highest level of education experienced large increases in longevity.
Perspective
- International comparisons of life expectancy for the least educated. To provide perspective on the magnitude of the negative effect of the absence of an education and all that accompanies this disadvantage on longevity, consider that black females with less than 12 years of education have the same life expectancy as women now living in Vietnam; black males with less than 12 years of education have the same life expectancy as men now living in India.
- Time frame of reference for the life expectancy of the least educated. It’s as if the uneducated population of the U.S. is living in a time warp: 1972 for white men; 1964 for white women; 1962 for black women; and 1954 for black men.
- At the root of the educational disparity in longevity is a profound inequality of opportunity and the strain that life at the bottom creates. The stress associated with being at the bottom of the social class ladder shortens lives. Being black and less educated is a double jeopardy.
- Race is still important. Even among the highest educated, whites still live longer than blacks, indicating that something about race itself is influencing duration of life independent of other SES variables.
- Researchers in the field of aging believe that we are on the brink of the next longevity revolution, but when it happens, not everyone is going to benefit equally, and some may not benefit at all. There now appear to be Two Americas in terms of longevity and survival prospects, and this divide will grow larger as new life-extending technologies come online.
Policy Recommendation
The solution to bringing the less educated subgroups of the population back into the 21st century is life-long learning and education – public policies that should be enacted now.
For More Information


Video Discussion of Publication on Education & Longevity

Sign Up for Updates